Table of Contents
Nerdlog: fast, remote-first, multi-host TUI log viewer with timeline histogram and no central server
(Or how I Implemented a Radically Simple Alternative to Graylog)
May 2025
Back in 2022, my team and I were working on a service which was printing a fairly sizeable amount of logs from a distributed cluster of 20+ hosts: about 2-3 million log messages per hour in total. We were using Graylog, and querying those logs for an hour was taking no more than 1-3 seconds, so it was pretty quick.
Infra people hated Graylog though, since it required some annoying maintenance from them, and so at some point the decision was made to switch to Splunk instead. And when Splunk was finally rolled out, I had to find out that it was incredibly, ridiculously slow. Honestly, looking at it, I don't quite understand how they are even selling it. If you've used Splunk, you might know that it has two modes: “Smart” and “Fast”. In “Smart” mode, the same query for an hour of logs was taking a few minutes. And in so called “Fast” mode, it was taking 30-60s (and that “Fast” mode has some other limitations which makes it a lot less useful). It might have been a misconfiguration of some sort (I'm not an infra guy so I don't know), but no one knew how or wanted to fix it, and so it was clear that once Graylog is finally shut down, we'll lose our ability to query logs quickly, and it was a massive bummer for us.
And I thought that it's just ridiculous. 2-3M log messages doesn't sound like such a big amount of logs, and it seemed like some old-school shell hacks on plain log files, without having any centralized logging server, should be about as fast as Graylog was (or at least, MUCH faster than Splunk), and it should be enough for most of our needs. Let me mention here that we weren't using any containerization: the hosts were actual AWS instances running Ubuntu, and our backend was running there directly as systemd services, naturally printing logs to /var/log/syslog, so these plain log files were readily available to us.
And so that's how the project started: I couldn't stop thinking of it, so I took a week off, and went on a personal hackathon to implement a proof-of-concept log fetcher and viewer with a simple terminal UI, which is ssh-ing directly to the hosts, and analyzing plain log files using bash + tail + head + awk hacks.
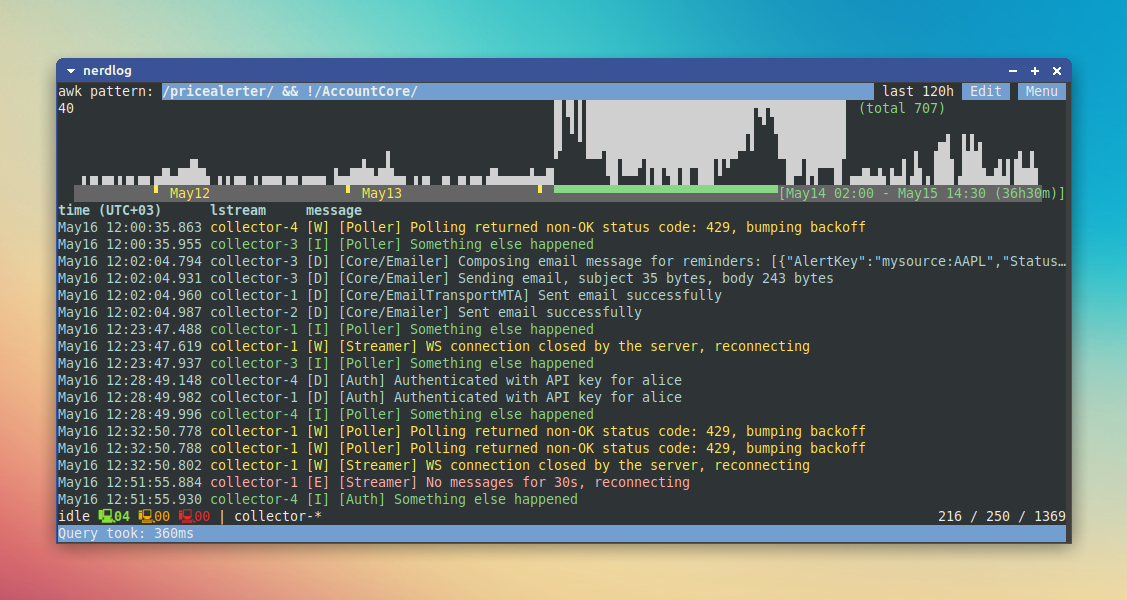
Here's what I demoed to the team the week after:
There is also a gif demo at the end, as well as github repository and documentation links; but if you're curious how it's built, read on.
Goals
The main goal can be summarized as just this: implement a log fetcher and viewer to cover most of our Graylog needs. My rough estimation was that in like 97% of cases, all we needed was to get logs with the timeline histogram for the past hour or day, filtering them with various patterns; and we needed it to work fast. That's really it.
The remaining 3% was to use some more advanced feature like getting message stats: most often just how many times a particular message has occurred, to find heavy hitters.
Obviously, I focused on the 97% part; and so the more specific goals were:
- Getting logs from multiple remote hosts at once
- Filtering logs by time range and patterns
- Timeline histogram outlining the filtered logs for the selected time range
- Only the most recent logs should be displayed on the UI, with the ability to fetch older logs, paginated
- Log querying should be fast enough. My North Star goal was to reach the Graylog-like level of performance (1-3 seconds to process 2-3M log messages from the last hour), but it wasn't a hard requirement: as long as it's significantly faster than Splunk, it was already a success. Still though, I badly wanted it to be as fast as Graylog.
Having these spelled out, let's move on to the implementation part.
Implementation: meet Nerdlog
The general idea was as follows:
- Client is a terminal UI application displaying logs and the timeline histogram, written in Go, utilizing this awesome TUI library: tview;
- Client app establishes a separate ssh connection to every host it needs to collect the logs from;
- To filter the relevant logs from the host and generate data for the timeline histogram, we use some standard GNU tools, such as
bash,awketc, over that ssh connection: this way, no provisioning of the hosts will be needed, and it'll work on vanilla Linux or FreeBSD instances out of the box; - On the client, we aggregate the responses (logs and timeline histogram data) from all the remote hosts, and present them on the UI.
Since the terminal UI does imply certain nerdiness, and as a nod to Graylog which was one of the main inspirations here (even if loosely), I called that project Nerdlog.
The most crucial and questionable part here was to make the log filtering (on the hosts, using GNU tools) fast enough. As you remember from the Goals section above, the North Star goal was to reach the Graylog-like level of performance (for our use case anyway, ymmv), and it took me a few iterations to get right. So let's talk about that.
Agent script
The agent script is the part which runs on the remote hosts and does the actual log filtering; it's just a bash script which utilizes other GNU tools. Upon connecting to each host, Nerdlog creates that script under /tmp, and then executes it as needed.
First of all, let's settle on where are we going to be reading the logs from, exactly.
Log sources
There are two main options: either read them from plain log files like /var/log/syslog (and older /var/log.syslog.1 etc), or just use journalctl.
Let me tell you in advance that as of 2025, Nerdlog already supports both options, so you're free to use whichever you prefer; but back in 2022, I had to pick one since I was in the hackathon mode, so let's elaborate a bit:
Journalctl pros:
- Could be easier to deal with for the Nerdlog use case: to get logs in a certain time frame, just fire up a command like
journalctl --since '2022-05-08 01:00:00' --until '2022-05-09 08:00:00'and that's it; no need to deal with multiple log files to find the relevant data - Universally available on any major Linux distro (as of 2025, it's even more universal than the log files: some distros don't install
rsyslogby default anymore, which makes me sad but alas) - Often has longer history comparing to what's available in the log files
Journalctl cons:
- It is, predictably, a lot slower than just reading from files. And I mean, a lot slower: in the benchmark I've done in 2025, it was like 90 times slower in my particular scenario; check out this comment on GitHub for details.
- It can miss logs (to be fair, Graylog can, too). During some intensive spikes of logs, it might drop some of them; we were definitely observing this behavior that some messages are clearly missing from the
journalctloutput, but when we check the plain log files, the messages are there. There is some kind of ratelimiting / buffer overflow going on there (and somehow the part which writes to the files enjoys not having these limits, or at least having more permissive limits). Somehow, the old school technology like plain log files keeps being more reliable than the new fancy stuff. - Not available of FreeBSD (this wasn't relevant to our original use case back when I was originally implementing Nerdlog, but just for completeness here)
So the first cons here made it a no-brainer for me to rule out journalctl: since the performance was one of the top priorities for me, I had to choose plain log files as a much more performant option. And also, I obviously didn't want to deal with the missing logs, having an option not to.
Filtering logs
Alright so plain log files it is, let's now talk about actually making use of them.
There are two kinds of filtering we need to do: first by the time range (to only look at the period we're interested in), and then by the patterns.
I quickly settled on awk as the workhorse for data processing here: it's more universally available by default than e.g. perl, very snappy, and in general felt like the right tool for the job.
Filtering by patterns
With awk, the pattern filtering is the trivial part here; awk even has built-in support for combining patterns with the boolean operators, so e.g. to find all logs not containing foo and containing either bar or baz, we can write: !/foo/ && (/bar/ || /baz/). I love it; it means we're getting a lot of Graylog-like querying power for free, without having to implement custom query parsing or resorting to ugly unreadable patterns.
So then, if we forget about the time range filtering for a moment, we can have this trivial bash+awk script which, for now, just prints the matching lines from the two latest syslog files:
#!/usr/bin/env bash

pattern="$1"
if [[ "$pattern" == "" ]]; then pattern="//"; fi

awk_script='
  # Filter out lines not matching the pattern
  !('"$pattern"') { next }

  # For now, just print the matching lines
  { print $0 }
'

cat /var/log/syslog.1 /var/log/syslog | awk "$awk_script" -
And we can call it as bash myscript.sh '!/foo/ && (/bar/ || /baz/)'
It's beautiful that the pattern matching turned out to be so trivial, but the time range filtering requires more work, so let's talk about that now.
Filtering by time range: the first naive attempt
Here's how the classic syslog (or, “messages”) format looks:
Mar 10 10:20:17 myhost myprogram[4163]: Something happened
What's important is that this timestamp in the beginning has fixed length; even if the day is just one digit (e.g. Mar 9), it's space-padded there:
Mar 9 23:58:01 myhost myprogram[4163]: Something happened
Which means that we can simply pass the time range bounds as two arguments formatted in exactly the same way like Mar 10 11:00, and then in the awk script, add two more conditions to filter out logs, like that:
  # Filter out lines outside of the time range
  (substr($0, 1, 12) <  "Mar 10 11:00") { next }
  (substr($0, 1, 12) >= "Mar 10 12:00") { next }
This works. The problem though is that it's not as fast as I wanted it to be. It's ok for small log files, but our log files were not small at all.
Let me actually elaborate on the volume a bit: I previously mentioned that we had 20+ hosts, and from all of them combined, we had 2-3 million log messages per hour. Let's assume that an average log line takes 200 bytes (it's not just the main message itself, it's typically also some context fields, e.g. field1=value1, field2=value2 etc.
So: 200 bytes per line * 3 million lines per hour * 24 hours, divided by 1GB = 13.4 GB of logs data per day.
However, it's more or less evenly distributed across all the hosts, which we have 20 of. So divided by 20, it's about 600-700 MB of logs per day on a single host.
Also, we need to deal with two log files: /var/log/syslog.1 from the previous full day, and also latest /var/log/syslog from the current incomplete day. Which gives us about 600 - 1400 MB of data that we typically need to deal with on a single host. Let's take the convenient mid point here and assume that the log file is 1GB.
And in my rough benchmarks, processing a 1GB log file with a bare bones awk script like that takes 2-3 seconds (and that doesn't include any logic to actually generate the timeline histogram data and recent log lines, transmitting that to the Nerdlog client app etc, which would multiply the time further 2x or 3x).
I mean, honestly even if it ends up being 5-10 seconds, that's already not bad at all comparing to the few minutes that we were having with Splunk, but I knew there must be a better way. Thing is, most of the time we're only interested in a very small fraction of logs that we have, and so most of that awk processing time is wasted (with each query, again and again). I guess the same can be said about the pattern filtering as well, but with the patterns we can't do any better, while with the time ranges, we can.
Filtering by time range: line number index
What's convenient about time ranges is that the log lines are ordered by time (well, mostly: there are corner cases, but let's not worry about them just yet). So basically “filtering by time range” just means selecting one single contiguous chunk of logs from all the logs that we have. Or rather, cutting irrelevant logs from the beginning and/or the end of logs data that we have.
Ideally, I wanted to have a tool which can perform line-based binary search in sorted text files and print the resulting line numbers (or even better, byte offsets; but we'll talk about it below); so basically I'd ask it “find the first line which starts with Mar 10 06:00, and it'd give me back the line number. Knowing that, I'd be able to use tail and head to quickly cut off the lines outside of the selected time range, and pipe the remaining part to awk.
Sadly, I wasn't able to find a standard tool like that. Sucks, actually. So I resorted to maintaining an index from a timestamp like Mar 10 06:00 to the corresponding line number; in the simplest form the awk script to generate it could look like this:
BEGIN { last_time = "" }
{
  cur_time = substr($0, 1, 12);
  if (cur_time > last_time) {
    last_time = cur_time
    print cur_time "\t" NR
  }
}
And the result will be:
Mar 10 00:47	1
Mar 10 00:48	2431
Mar 10 00:49	5291
Mar 10 00:50	8196
Mar 10 00:51	11096
...
That script also takes 2-3 seconds to run on the same 1GB file, but it only needs to reindex the whole thing once per log rotation (which typically means once per day, or even per week, depending on rsyslog configuration). Aside from that, it only needs to index “up”: when the timestamp specified by the user is later than the last timestamp in the index, we just index the remainder part of the log file, which is much faster than indexing the whole thing.
Having an index file like that, we can modify our original bash script as follows (for simplicity of the demo code, handling of various corner cases is omitted, and we're only looking at a single log file):
#!/usr/bin/env bash

LOGFILE=/var/log/syslog
INDEXFILE=/tmp/nerdlog_index

pattern="$1"
if [[ "$pattern" == "" ]]; then pattern="//"; fi

from="Mar 15 07:00" # Just hardcode timestamps for demo purposes
to="Mar 15 08:00"

# Takes a timestamp like "Mar 10 00:54", and prints the first line number
# with that or later timestamp.
function get_lineno_from_index() {
  awk -F"\t" '($1 >= "'"$1"'") { print $2; exit; }' "$INDEXFILE"
}

from_lineno="$(get_lineno_from_index "$from")"
to_lineno="$(get_lineno_from_index "$to")"

awk_script='
  # Filter out lines not matching the pattern
  !('"$pattern"') { next }

  # For now, just print the matching lines
  { print $0 }
'

tail -n +$from_lineno "$LOGFILE" |         \
  head -n $((to_lineno - from_lineno)) |   \
  awk "$awk_script" -
With this change, the speedup is dramatic: with the same 1GB log file, if we're only looking at one hour (out of 24 hours available in the log file), then instead of 2-3 seconds, it now takes 300-400ms, so about 7-8 times faster.
Note that the awk script is not concerned about the time ranges at all now: we completely offload the time range filtering to the tail and head, and the awk script receives data for the relevant period only.
Filtering by time range: byte offset index
We can still do better though: the tail -n and head -n operate on line numbers, so they have to scan the all the lines before the one we're looking for, and that sucks.
Since we're generating an index file in the first place, then instead of storing the line numbers, we can instead store the byte offsets: then, we can use tail -c and head -c, which operate on bytes, and really the first tail -c (which reads from the file on disk) becomes just an lseek under the hood, which is nearly instant.
To generate the index file with byte offsets, we also have to use the awk --characters-as-bytes flag (or just -b), because otherwise awk treats multibyte chars as having the length 1, and there is no way to get the actual byte offset.
Unfortunately, all of this (awk -b, tail -c, head -c) are GNU extensions and are not POSIX-compatible, but for the use cases that Nerdlog targets primarily, it's reasonable to assume GNU and get some extra performance. If there are actual use cases where POSIX compatibility is important, it's possible to implement a fallback mode too. Let me know if you need it.
So the modified awk script to generate the index becomes:
# NOTE: awk must be called with --characters-as-bytes or -b flag
BEGIN { last_time = ""; bytenr = 1; }
{
  cur_time = substr($0, 1, 12);
  if (cur_time > last_time) {
    last_time = cur_time
    print cur_time "\t" NR "\t" bytenr
  }

  bytenr += length($0)+1;
}
And the resulting index:
Mar 10 00:47	1	1
Mar 10 00:48	2431	486204
Mar 10 00:49	5291	1010581
Mar 10 00:50	8196	1827708
Mar 10 00:51	11096	2418928
...
(we have the line numbers here too, since they're still useful e.g. to show the original line number of a particular log message in the UI)
I'm not going to post the full updated bash script; we only need to change the field that we use in the index: $3 instead of $2, use -c instead of -n for both tail and head, and also rename some variables to mean byte offsets instead of line numbers.
This gives us additional 2-3x speedup (so in total 15-20x comparing to the initial naive implementation) on the same 1GB file, and so it takes 100-150ms now.
Alright now we're finally talking! Even though it's just the filtering part, without printing any useful data, it definitely promises to be fast enough at this point.
Printing useful data
Now that we have all the necessary filtering in place, we need to do something useful with the logs which match our filters. As mentioned before, the Nerdlog app needs two primary kinds of data from every host:
- Data for the timeline histogram;
- A few last log messages to actually show on the UI.
To power the timeline histogram, we just need a mapping from a particular time period (such as 1 minute) to the number of messages that happened during that time period. Nerdlog's current granularity is always 1 minute, so we can simply use the literal minute string as it occurs in the log files as the map key: "Mar 10 09:39".
And to print the last N messages, we'll just maintain a circular buffer of them, as another mapping keyed by integers [0..N).
In the end, we just print both maps. Here's the resulting awk script:
awk_script='
  BEGIN { curline=0; maxlines=10; }

  # Filter out lines not matching the pattern
  !('"$pattern"') { next }

  {
    # Add the current message to the timeline histogram data.
    stats[substr($0, 1, 12)]++;

    # Maintain the circular buffer of the last log messages.
    lastlines[curline] = $0;
    curline++
    if (curline >= maxlines) {
      curline = 0;
    }
  }

  END {
    # Print the histogram data.
    for (x in stats) {
      print "s:" x "," stats[x]
    }

    # Print the most recent log messages.
    for (i = 0; i < maxlines; i++) {
      ln = curline + i;
      if (ln >= maxlines) {
        ln -= maxlines;
      }

      if (!lastlines[ln]) {
        continue;
      }

      print "m:" lastlines[ln];
    }
  }
'
And here's an example output:
s:Mar 10 00:52,1892
s:Mar 10 00:53,3044
s:Mar 10 00:54,1201
s:Mar 10 00:55,1459
s:Mar 10 00:56,1294
s:Mar 10 00:57,940
s:Mar 10 00:58,1356
s:Mar 10 00:59,1320
m:Mar 10 00:59:54 myhost kern[5156]: <err> Authentication failure
m:Mar 10 00:59:54 myhost daemon[1069]: <alert> SSH connection established
m:Mar 10 00:59:54 myhost news[1940]: <emerg> Security alert raised
m:Mar 10 00:59:54 myhost uucp[4680]: <debug> Permission denied
m:Mar 10 00:59:54 myhost user[5850]: <err> Memory leak detected
m:Mar 10 00:59:54 myhost user[6036]: <notice> Database migration failed
m:Mar 10 00:59:55 myhost ftp[2145]: <warning> Service initialization failed
m:Mar 10 00:59:55 myhost cron[972]: <alert> Scheduled task failed
m:Mar 10 00:59:55 myhost auth[3112]: <emerg> System rebooted
m:Mar 10 00:59:56 myhost mail[5664]: <debug> Network unreachable
This added 2x - 3x time again, so we're back in 200-300ms territory, which is still more than good enough.
And that's the bare minimum agent script, really. The client app reads these lines from stdout, parses them, aggregates the data from all the hosts, and presents it to the user.
Yes it is missing a lot of details to make it work properly in all cases, but it is actually a working prototype of the agent script to query logs from plain log files, and in my opinion, it's impressively performant.
Missing details
I'm obviously omitting a lot of things here, such as error handling, reading continuous logs from more than one file, index invalidation and regeneration, gzipping the data in transit, printing some progress info, handling corner cases like the requested timestamps being outside of the available logs range, decreased timestamps (it happens sometimes), different timestamp formats, etc etc.
So the actual implementation is not gonna be that simple. In fact, currently this agent script is so messy and barely readable so I'm not even going to post a link to it here. I'm hoping to give it a major rewrite at some point, but not bothering for now, because it works and is covered with solid tests, so I'm not too worried about breaking it. If you're really curious, feel free to find the nerdlog_agent.sh file in the repo yourself (I'll link the repo below). Abandon all hope before opening that file.
Client app
So once it was clear that querying the logs from plain text files is indeed a viable approach, it was time to work on the client Nerdlog app. It has two main parts, and both of them were relatively uneventful to implement:
- UI: I guess the most time-consuming part here was to get the timeline histogram working as I wanted, since I had to create a brand new widget for that and handle all the drawing and event handling manually; but everything else was pretty much covered by tview out of the box (kudos to Oliver for it!);
- Connection management and log aggregation: while a bit more time-consuming, also not too interesting.
I'm not gonna go into much implementation details here. Check out the Github repo if you're curious!
Hackathon results
Having it all put together, the query performance was better than what I was hoping for: the same query which processes 2-3M log messages for the past hour was almost always below 2s, which beat even Graylog on our use case. And it wasn’t just faster, it was also more reliable: unlike Graylog, it didn’t reorder or drop messages.
I actually find it interesting and satisfying that a solution which is conceptually very simple can be so effective and reliable. I mean, it's just plain text files, processed by some standard tools which were around for a few decades now, over plain ssh. Nothing fancy at all. I do miss simplicity like that in the modern day software, where everything seems to be as overengineered as possible.
Demo
Finally, here’s a quick demo showing Nerdlog in action, working with four remote hosts:

Project status
Since that initial implementation in 2022, the code still has some traces of the hackathon style and could be more polished, but the project has matured significantly. To summarize a bit:
- Only the minimal amount of data is downloaded from the hosts, saving time and bandwidth;
- Most of the data is gzipped in transit, saving the bandwidth further;
- Other than plain log files, it supports
journalctlas well now (it's much slower than reading the plain log files, but that difference only matters in practice if there are a lot of logs) - Portable across major platforms: tested on various Linux distros, FreeBSD, MacOS and Windows (only the client app can run on Windows though, we can't get logs from Windows hosts).
I've been using it at work and for my personal projects for a few years now, and I consider it ready to be used in the wild on actual production systems. Of course a lot more work could be done, and there are some features that I do want to see implemented (see details below), but it already proves to be capable of solving real needs, using very simple concepts.
How does it actually compare to Graylog?
It's obviously not an equivalent of Graylog, but at least for me, it has proven to be a very viable alternative. For most of my logging needs, Nerdlog is more than enough. In fact, even better in a few ways:
- It doesn't miss or reorder logs like Graylog does. At least in our setup, Graylog was set up with UDP, so a message can be dropped (and they are, sometimes), and also if multiple messages happen to have exactly the same millisecond timestamp, they can be reordered, which is annoying.
- This one is subjective, but I found it refreshing to use a snappy keyboard-navigated terminal app instead of kinda-clunky web UI. YMMV.
Also, the fact that there's no setup or centralized server required is especially interesting: not only it makes Nerdlog very suitable for tiny hobby projects and startups, it also opens up interesting use cases for DevOps / system admin folks, who often need to work with arbitrary servers set up by different people. On most of these systems, Nerdlog will work out of the box.
Having that said, Graylog definitely has advantages, too:
- For containerized deployments, Graylog is likely a better fit. It's possible to set up Nerdlog with Kubernetes too, but it might be defeating the purpose at this point;
- Graylog has certain useful features which Nerdlog doesn't, yet:
Notably missing features
Custom field parsing
Like Graylog and other log systems, Nerdlog does actually support separate fields for every log message, as you saw in the demo above: the UI doesn't just display raw log lines, it parses them into at least time and message, and also some extra fields coming from the syslog file format: program, hostname and pid fields. There is also lstream, but this one is actually special because it doesn't come from the logs being parsed: it's just set to the name of “logstream” that these logs are being collected from (See the docs for more info on logstreams).
The problem though is that as of today it's not customizable: there is hardcoded logic in Go to parse syslog (you can check out the parseLogMsgEnvelopeDefault and parseLogMsgLevelDefault functions in the lstream_client.go file), but there is no way to implement app-specific message parsing without modifying the Go source code.
In fact, that's what we were doing for our own services: we had the extra fields printed as field1=value1 field2=value2 etc at the end of every log line, and we had custom Go function to parse these.
You can do the same (it's open source, after all), but to make it less cumbersome, my plan is to integrate some Lua scripting, so that the user can specify their own custom logic to parse the messages in whatever way, and then we can have any number of custom fields without having to modify the sources.
Btw, to avoid any confusion: this message parsing (regardless if in Go or in Lua) only runs on the client app, so only the messages that are about to be shown in the UI need to be parsed. So if we have a large volume of logs, then the querying discussed above will stay fast, since it's completely unrelated to this message parsing. Only when the client app receives responses from every host, then it will parse the messages it received before rendering them on the UI.
Statistics
Another missing and nice-to-have feature is statistics, like e.g. getting distinct messages and the number of times they occurred.
Graylog calls these “Quick Values”. We can't implement it in exactly the same way as in Graylog, because these Quick Values are centered around fields and their values, but in Nerdlog, even though we can also have separate fields as discussed just above, these fields only exist on the client side. They don't exist in the awk script which does the actual data processing, and therefore there is no universal way to build stats around them.
What we can do instead is to use regular expression with match groups; e.g. if the raw log files have things like myfield=some_value, we should be able to write regular expression like \bmyfield=([a-zA-Z0-9_]*), and get statistics of all the values it matches, and how many times they occurred. The need for something like that only comes up occasionally, and that's why it's still not done, but I do want to implement it at some point. For me, this will be literally the last significantly missing feature comparing to Graylog.