Table of Contents
Visualizing the Heap on Embedded Devices
The heap on a device is usually a kind of black box: heap API rarely provides anything more than just returning free space size, and quite often it doesn't provide even that (since C standard doesn't oblige it to). We have little idea of the fragmentation (in particular, we're interested in longest contiguous free chunk of memory) and the behaviour of the allocator in general. But in the resource-limited circumstances we're highly concerned about being memory efficient, right?
We use ESP8266 as one of the Smart.JS platforms. We're lucky enough to have at least system_get_free_heap_size() in the SDK's API, but unfortunately it turned out to be a common situation to have about 6K of free RAM, then try to realloc some buffer from 2 to 2.5K, and get “out of memory” error. Obviously, we're beaten by the fragmentation (at least), but before we have a chance to improve anything, we have to get more statistics than just free heap size. That's how the heaplog+viewer has started.
The idea is quite simple: we wrap allocator functions into our own functions (by means of the ld --wrap feature), which call real allocator, and then output heap usage log to UART.
For example, SDK has a function pvPortMalloc, which we want to wrap, so, we invoke a linker with --wrap=pvPortMalloc option, and implement our own function __wrap_pvPortMalloc, which among other things calls actual malloc: __real_pvPortMalloc.
The format could be something like:
hl{m,16,3fff0370}  # malloc 16 bytes, pointer is 0x3fff0370
hl{m,32,3fff0390}  # malloc 32 bytes, pointer is 0x3fff0390
hl{f,3fff0370}     # free buffer at address 0x3fff0370
...
The format is chosen to be rather dense, since these messages are printed quite often, and we want to spend as little time sending them via UART as possible. The hl above stands for heaplog.
After this, we can grab this text data, parse it, and display conveniently on a host mashine, where we have plenty of resources. Heaplog viewer is written in JavaScript; it analyzes heaplog text data, calculates some statistics (max heap usage, worst-case longest free chunk of memory, etc), and allows the user to observe the heap usage evolution, displaying the heap visually. Cheap and useful.
And even though the heaplog feature was implemented to analyze the behaviour of the allocator, it is equally useful to get the overall idea of how good any particular application is doing; it may help to spot leaks, etc. Use it! You can find it in Smart.JS repository. Clone it, open the file tools/heaplog_viewer/heaplog_viewer.html in your browser, click “Choose File”, and select the text log file with the output from the device.
Analysis of the standard allocator
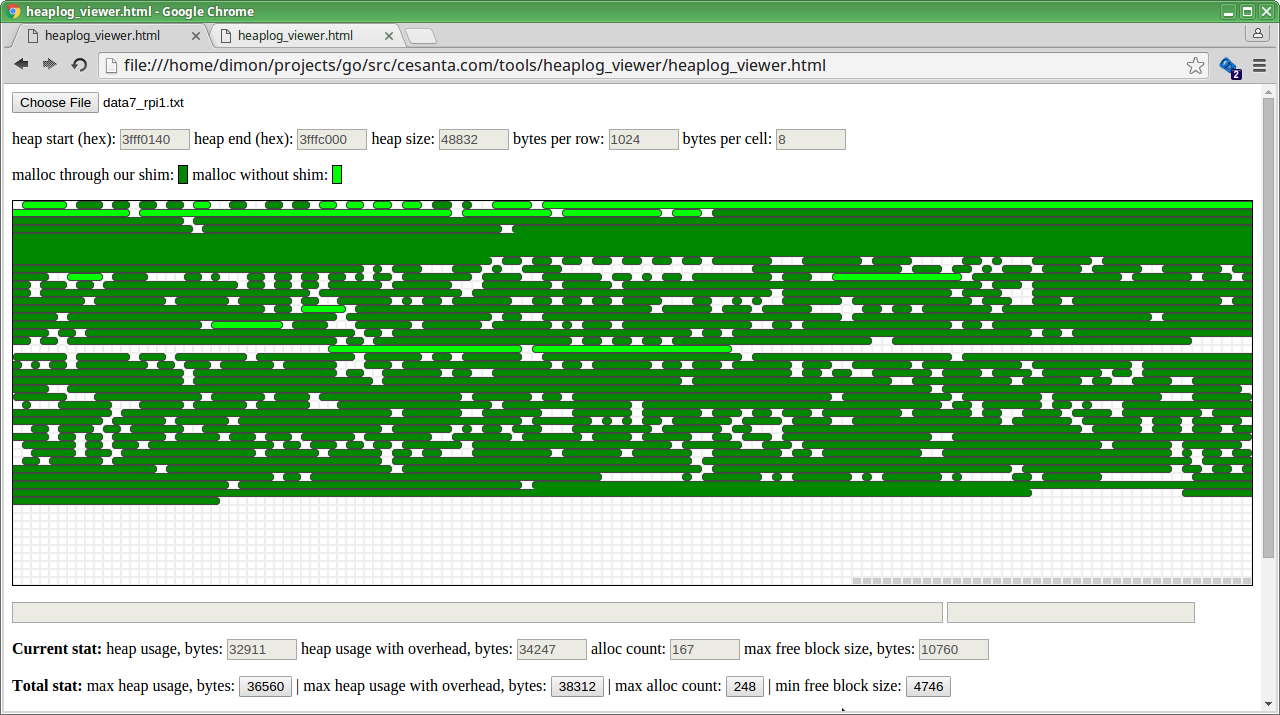
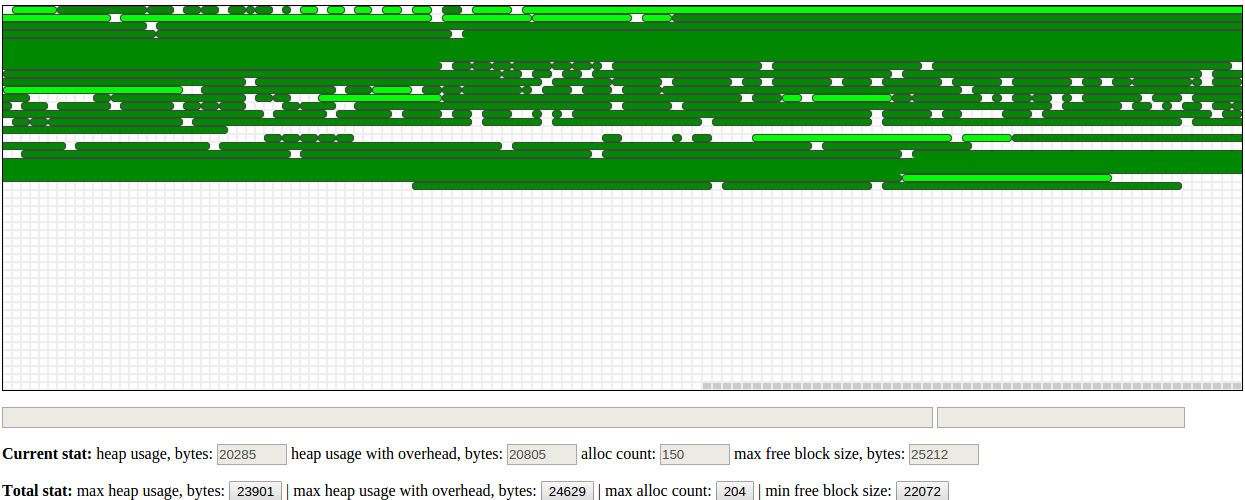
Now that we have a tool, we can understand better what's going on under the heap's hood. The first obvious thing to do is to build Smart.JS with heaplog feature, and then just let the device work for some time (say, 30 seconds), and see what the heap looks like. Here we go:
This is the picture after 30 seconds of working. Each row on the map corresponds to 1 KB, each cell is 8 bytes, so, we can immediately see that each allocation has minimum overhead 8 bytes, since the minimum gap between two adjacent allocated chunks of memory is 1 cell.
If we examine how chunks are allocated, one by one, it becomes clear that the algorithm is pretty easy: it just allocates first found block whose size is more or equal to the requested size. Well, while I'm not happy with this algorithm in such a limited embedded device, this is what I would expect: all other embedded SDKs that I've worked with have very similar heap implementation.
But there is one thing that really disappointed me: the behaviour of realloc(). Take a look at this series of reallocs:
It's clear that the allocator never actually extends existing buffer, even though there is a room for that; instead, it effectively does malloc() followed by free(). It means that for each realloc we actually have to have twice more memory than we might need to have.
When we have just a few free kilobytes in total, this behaviour isn't something we'd like to cope with, so, a call for a better allocator was made.
Meet umm_malloc by Ralph Hempel
In my previous embedded-programming practice, I have used a great allocator for embedded systems: umm_malloc, initially developed by Ralph Hempel. I worked with Microchip CPUs those days, and comparing to standard Microchip-provided allocator, umm_malloc has provided a much better heap layout in terms of fragmentation. So I decided to try umm_malloc for Smart.JS on ESP8266.
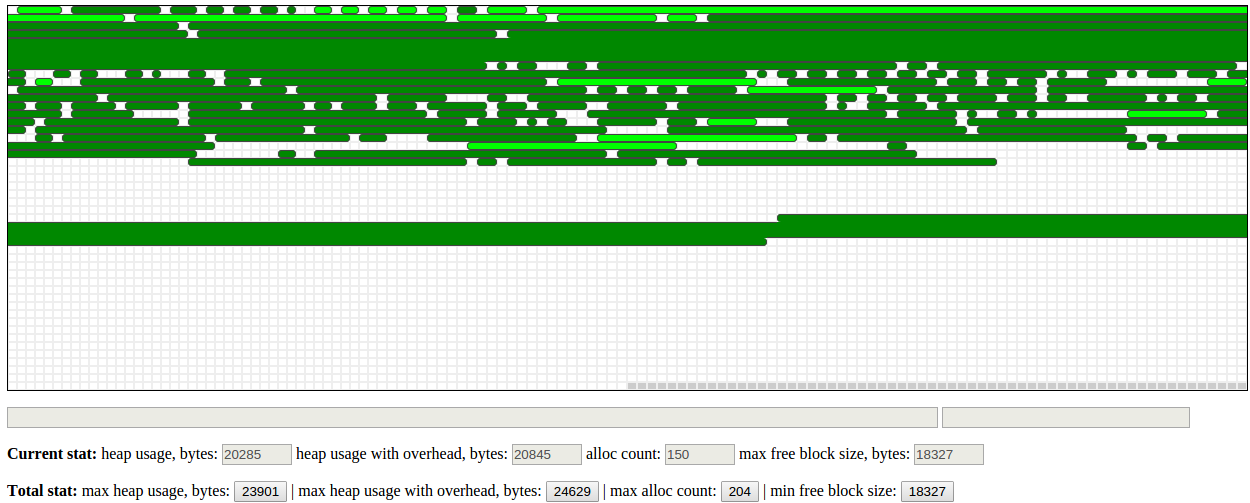
The quickest-n-dirty way to replace standard allocator with a custom one is to use the same --wrap feature of the linker, but this time, __wrap_... functions should call some custom allocator functions instead of __real_... functions. So, here we go; the same firmware with new allocator, and after 30 seconds, heap map looks as follows:
Well, it's clearly better than what we had with standard allocator: data is stored in a denser manner (there are 4 bytes of overhead per allocation), and we have less fragmentation: the worst-case longest contiguous free chunk is now 21.6K, instead of 18.3K. That's because umm_malloc uses “best-fit” algorithm when choosing where to allocate new chunk of requested size, which clearly helps to reduce the fragmentation.
And still, the heaplog viewer reveals that the behaviour is sometimes suboptimal, if not weird. Consider:
So, we have a lot of free space at the end of the heap, we need to allocate about 200 bytes, and, for some reason, they are allocated not at the beginning of the free space, but somewhere in the middle! No thanks, that's not what we want.
Improving umm_malloc
Umm_malloc is a nice and well-documented library, so it was a pleasure figuring out how it works and what is the reason of this strange behaviour.
You can find the very detailed explanation of its internals at the top of umm_malloc.c file. Very briefly: umm_malloc thinks in terms of blocks, not bytes. Each block consists of 8 bytes, and the whole heap space is split into these blocks. A block has:
- Index of the first block of the next chunk
- Index of the first block of the previous chunk
- Index of the first block of the next free chunk
- Index of the first block of the previous free chunk
So, it doesn't store pointers (which are 32-bit on ESP), it stores block indexes instead, which are just 15 bits (1 bit is used as a free mark for a chunk). Plus, it goes one step further: obviously, indexes of next/previous free chunks make sense for free chunk only. So, if the block isn't free, we can store user data instead of last two indexes! Therefore, we have just 4 bytes overhead per allocation, and it allows us to store about 256K of heap. More than enough on ESP8266.
If index of the next chunk is 0, it means that there are no more chunks. And, obviously, the same with free chunks.
However, it turns out that there are 2 issues in allocation algorithms, and they both contribute to the strange behaviour above:
- Initially, the heap is not represented as just one huge free chunk of memory. Instead, it is a kind of “unallocated”: we have just one block at the beginning, which has its both next indexes set to 0, i.e. it's the last block. When umm_malloc needs to allocate some chunk, and it reaches the last block, it doesn't mean Out of memory. Instead, umm_malloc checks whether there is a room in “unallocated” space to create new chunk of requested size. If yes, the chunk is created, and pointer to it is returned to the user.
- When umm_malloc allocates some data in an existing free block, the data is allocated at the end of the block. Among other things, this is
realloc-unfriendly.
So, have you guessed how the two issues above can cause umm_malloc to allocate some block in the middle of free space?
Yes, it's not a hard thing to imagine. Consider just 3 steps:
- We need to allocate new chunk of memory (say, 1000 bytes), and it doesn't fit in any of the existing free blocks. However, there is enough room in trailing unallocated space, so, new chunk of memory is created, whose size is 1000 bytes.
- This chunk is freed. Now, we have a trailing free chunk of memory, whose size is 1000 bytes, followed by unallocated space of some size.
- We need to allocate new chunk of memory, say, 200 bytes, and it can't fit in any free chunk other than the one we freed in the previous step, so we use this last free chunk. But since umm_malloc allocates data at the end of the block, what we have now is a gap of 800 bytes, followed by allocated 200-bytes chunk, followed by the unallocated space!
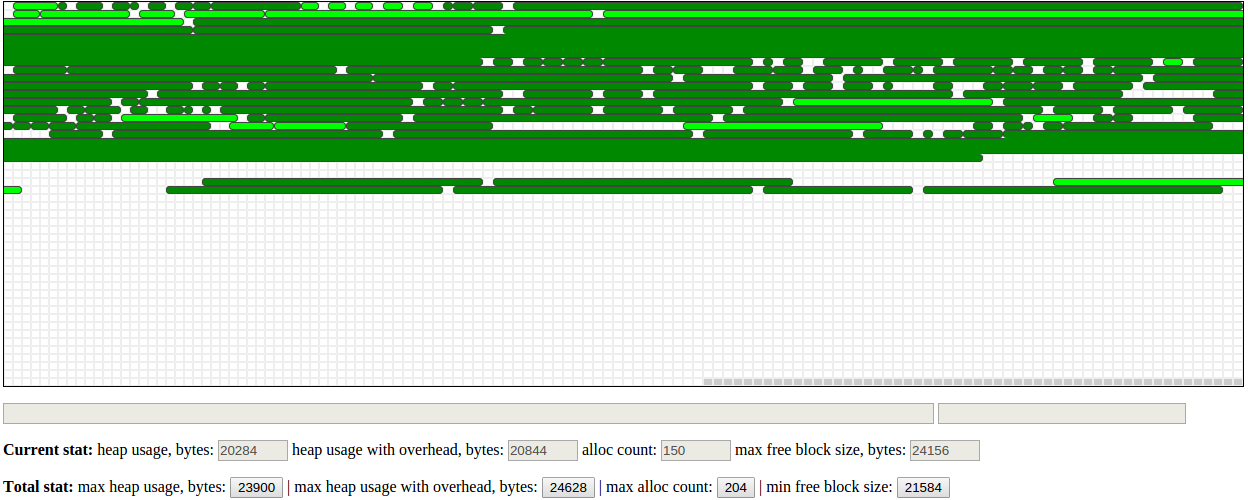
I believe this was overlooked by the author of umm_malloc (probably due to lack of the heaplog viewer), so I fixed that. After the fix applied, in the same condition after 30 seconds of working, the device's heap map looks even better:
Ah cool, that's what I'd like to live with!
Further improvements
If you ask me what kind of bugs I find the most painful, I'd say: memory corruptions. We may overflow buffer somewhere, and if we're lucky enough, the program will crash immediately. But still, the crash will most likely happen far away from where the actual bug is.
But what is worse, the bug like that may stay unnoticed for a long time. That's why we decided to implement heap integrity check and poisoning.
Heap integrity check
As the name suggests, integrity check causes umm_malloc to make sure that the heap data is consistent, before every heap operation. Since we use doubly-linked lists, it's rather easy: if block #X has Y as an index of the next block, then block #Y should have X as an index of the previous one. Plus, some other checks are performed. This check only causes performance overhead, but it does not consume any extra memory, so, in Mongoose IoT Platform, it is enabled by default. Still, it is not the strongest way to catch buffer overflow bugs:
- Allocated buffers are aligned by 8 bytes, so, if user asked to allocate, for example, 14 bytes, there will be some trailing data, and nothing will actually break if the buffer gets overflown by 1 or 2 bytes;
- Even when integrity violation detected, we may not be able to say for sure, which buffer is overflown: is it the “next” pointer of block X corrupted, or maybe “prev” pointer of the block Y?
So, if we want even better control on the overflows, we may want to use poisoning:
Heap poisoning
When poisoning is enabled, each allocated buffer is surrounded with “poison”: predefined value 0xA5, which is checked afterwards. Together with poison, we also need to store exact size requested by user, so that overflows by even 1 byte will always be caught (provided that this byte is not equal to 0xA5, of course)
Obviously, poisoning consumes extra memory, so it is not enabled by default. To build Mongoose IoT Platform with poisoning enabled, build it with $ make CFLAGS_EXTRA='-DUMM_POISON' . You may also want to fine-tune the amount of poison added to each allocated buffer, just look into the umm_malloc configuration file: platforms/esp8266/user/umm_malloc_cfg.h. By default, it's 2 bytes before the allocation, and 2 bytes after.
Integration of umm_malloc
It wouldn't be very nice to keep using ld --wrap feature to replace allocator with the custom one; especially because we need to wrap either of the allocators with the heaplog-specific wrappers.
So, I had to figure where heap-related functions are stored, weaken them with objcopy, and provide our own implementation. It turns out that they are stored in the file mem_manager.o from the archive lib/libmain.a. So let's weaken all symbols from it:
$ xtensa-lx106-elf-ar -x libmain.a
$ xtensa-lx106-elf-objcopy --weaken mem_manager.o
$ xtensa-lx106-elf-ar -rc libmain.a *.o
$ rm *.o"
Now, we need to provide our own implementation of pvPortMalloc() and friends, and we're done! While we can't yet get rid of heap on ESP whatsoever (which probably could be a good idea in terms of determinism), we improved its behaviour significantly.
I have worked with a few embedded SDKs (by Microchip, Keil and Espressif), and all of them have really dumb built-in implementation of the heap. Taking in account how expensive the RAM is on target devices, I'm really wondering why don't they use something more efficient: for example, umm_malloc, or probably something even better, which I'm not yet aware of.
Discussion
Dmitry
Thanks for the article. Nice to read.
Regarding embedded memory systems. “Normal” heap allocs, like your first examples, and probably like the second, when you alloc randomly sized blocks, _will_ fragment, and run out of enough contiguous free space, preventing successful allocs even though there is “enough” free space. Try your tests for a couple of billion random operations without fully freeing all your allocations. (i.e. Alloc random until full, keeping a list of allocations, free random _subset_ (half) of that, then attempt a long list of new allocs of random sizes until failure, then free subset… for millions of cycles. You will be surprised).
I found the way around this is to use alloc sizes of powers of 2, as outlined in Knuth, volume 4. Google “buddy memory allocator”, or see my implementation: https://github.com/BACnetEd/BuddyMemoryMallocFree
Keep up the good work. Ed